
Replacing labelling techniques with improved, label-free image processing
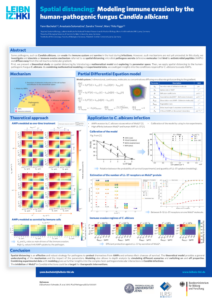
Host-pathogen interactions are ideally studied by imaging confrontation assays, where interacting cell types are monitored during and/or after their interaction. The resulting images are quantified via automated segmentation and classification algorithms, which help to unravel biological functions from host-pathogen interactions. While the segmentation of fluorescently labeled cells has already been established in previous works, we now introduce an analysis framework for unlabeled cells participating in such interactions. Acquiring images of unlabeled biological samples has multiple advantages: it saves the time and expense spent on fluorescence labeling, and minimizes the side effects that fluorescence labeling may have on biological functions. To analyze the images of both labeled and label-free confrontation assays and to visualize the extracted data, we introduce a new and complete open-source toolkit based on Fiji and R. This algorithm for confrontation assay quantification (ACAQ) is a toolkit that consists of the ACAQ Analyzer and the ACAQ Visualizer.
The ACAQ Analyzer and ACAQ Visualizer
ACAQ Analyzer was designed to identify cells in two-dimensional microscopy images, using either fluorescence labeling or transmitted light bright-field microscopy. In the latter case, a segmentation method based on a Hessian-filter was used, which enables distinguishing between different types of round-shaped cells that differ in size, a prerequisites that is typically met in host-pathogen confrontation assays. The ACAQ toolkit computes a collection of phagocytosis measures, as well as common morphological descriptors. The results are automatically visualized by the ACAQ Visualizer and can be exported for further data processing.
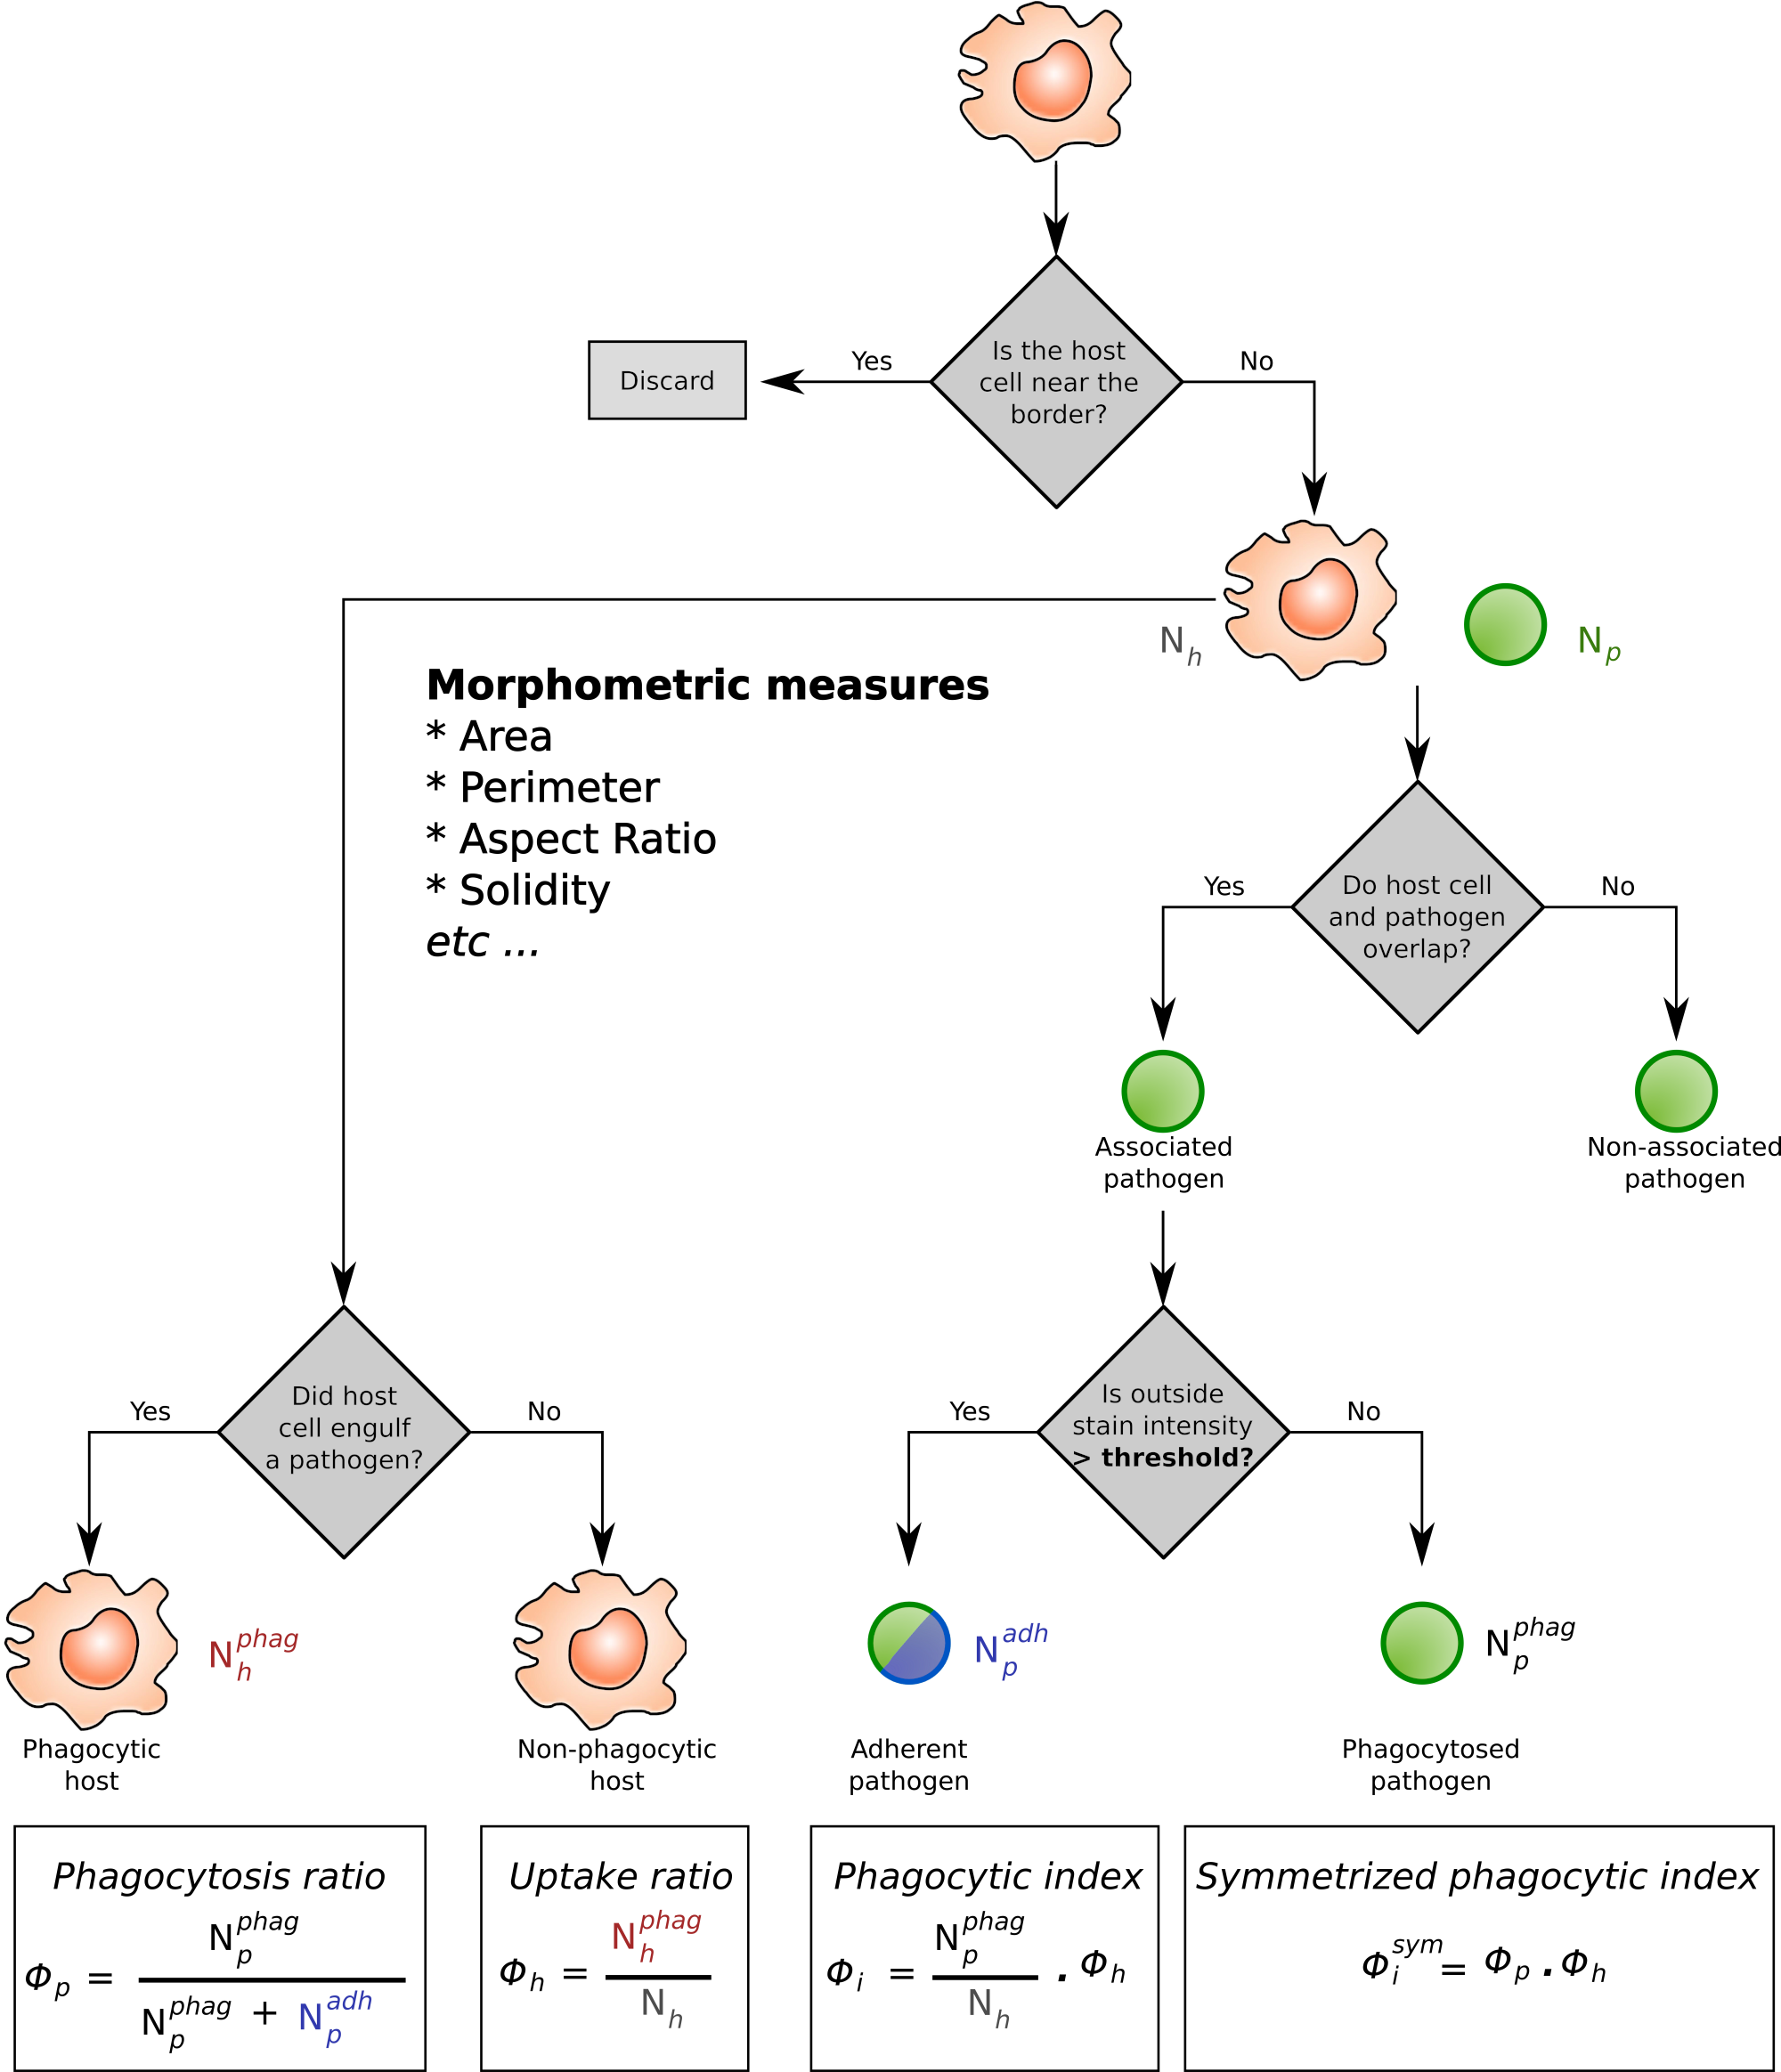
Analysis workflow of host-pathogen interactions.
The immune cells are shown as roundish shapes in orange. Pathogens are shown in green, typically these are fungal spores attacking e.g. the alveloli of the lung. The immune cells are indentified via a Hessian filter–based algorithm, whereas the fungal spores can be detected either via the same approach, or via fluorescence labelling. In addition, the fungi are often labelled with a counter–stain to separate the phagocytosed and non–phagocytosed pathogens. The four phagocytic measures (Phagocytopsis ratio; Uptake ratio; Phagocytic index; Symmetrized phagocytic index) are calculated from the proportion of phagocytosing immune cells ($N_h^{phag}$) and phagocytosed pathogens ($N_p^{phag}$).
Publications
- Muljajew, Huschke et al.(2021) Stealth Effect of Short Polyoxazolines in Graft Copolymers: Minor Changes of Backbone End Group Determine Liver Cell-Type Specificity. ASC Nano 15, 12298.
- Stanford, Matthies et al.(2021) Expression Patterns in Reductive Iron Assimilation and Functional Consequences during Phagocytosis of Lichtheimia corymbifera, an Emerging Cause of Mucormycosis. Journal of Fungi 7(4), 272.
- Hassan et al. (2020) Functional surface proteomic profiling reveals the host heat-shock protein A8 as a mediator of Lichtheimia corymbifera recognition by murine alveolar macrophages. Environmental Microbiology 22(9), 3722.
- Cseresnyes, Hassan et al. (2020) Quantitative Impact of Cell Membrane Fluorescence Labeling on Phagocytosis Measurements in Confrontation Assays. Front Microbiol 5 June
- Hassan, Cseresnyes et al. (2019) The geographical region of origin determines the phagocytic vulnerability of Lichtheimia strains. Environmental Microbiology 21(12), 4563.