
We have together with our colleagues at HKI Bio Pilot Plant we have developed a strategy to encode and decode sub-populations among microfluidic droplets. This allows us to incubate and scan droplets with different experimental conditions in parallel. Experimental conditions are encoded by the co-encapsulation of colored polystyrene beads together the biologically relevant material. Each experimental condition is encoded by a unique color combination and the condition is decoded in two steps. First, each bead is segmented and color classified using a Random Forest. As even the best classifier will make a few mistakes, Bayesian inference is used to determine the most likely color code encapsulated in the droplet given the bead color distribution and knowledge about the performance of the Random Forest classifier. The coding/decoding strategy has proven to have an accuracy >99% for 20 different experimental conditions.
Experimental Collaborators
- HKI Bio Pilot Plant at the Leibniz-HKI in Jena, Germany.
Data generation and incubation
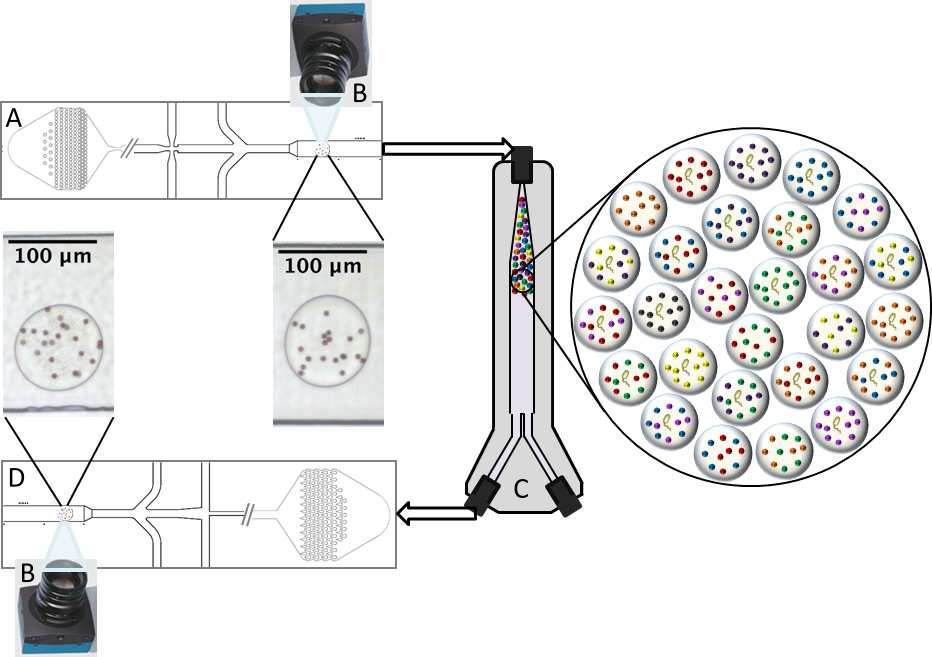
Overview of the droplet generation process (A) and the triggered image capture of droplets with no growth (B). After incubation for eight hours (C), droplets are reinjected and imaged again (D) to determine which if microbial growth occurred and what experimental condition that the droplet belongs to.
Droplet segmentation, decoding and growth detection
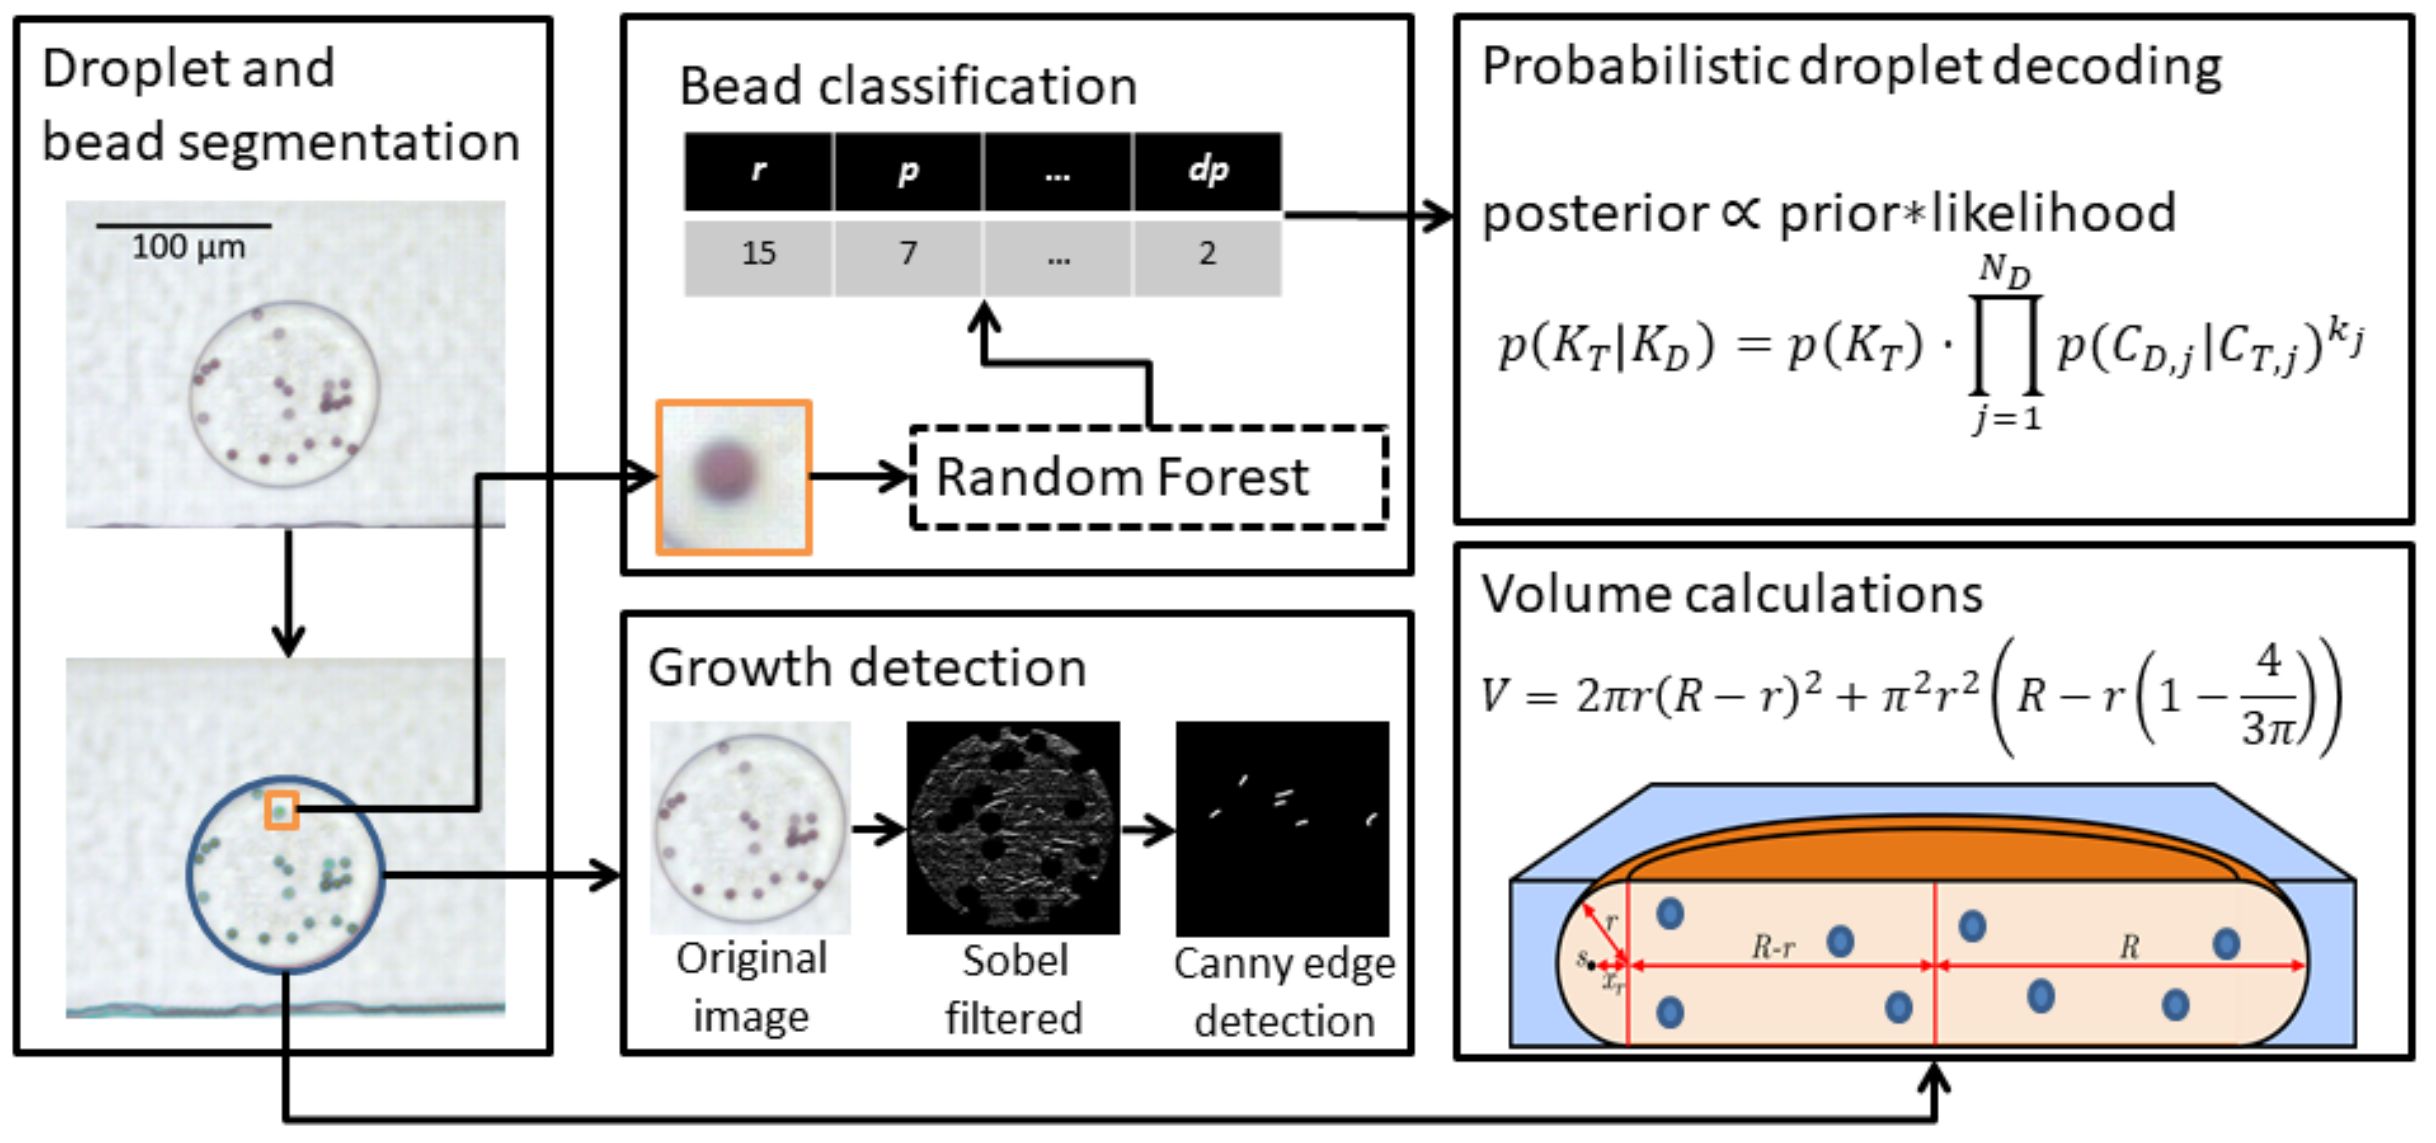
Workflow illustrating the main concepts of droplet segmentation, growth detection, bead classification and droplet decoding. Droplet and bead segmentation is performed using classical image analysis, while the color of individual beads is determined using a Random Forest classifier. To correct for classification errors, a decision system based on Bayesian inference is used to determine the most likely color combination in each droplet. Detection of microbial growth, in this case Escherichia coli, is done using classical image analysis methods. An important control parameter, especially after incubation, is the droplet volume to ensure that droplets have not split up or merged.
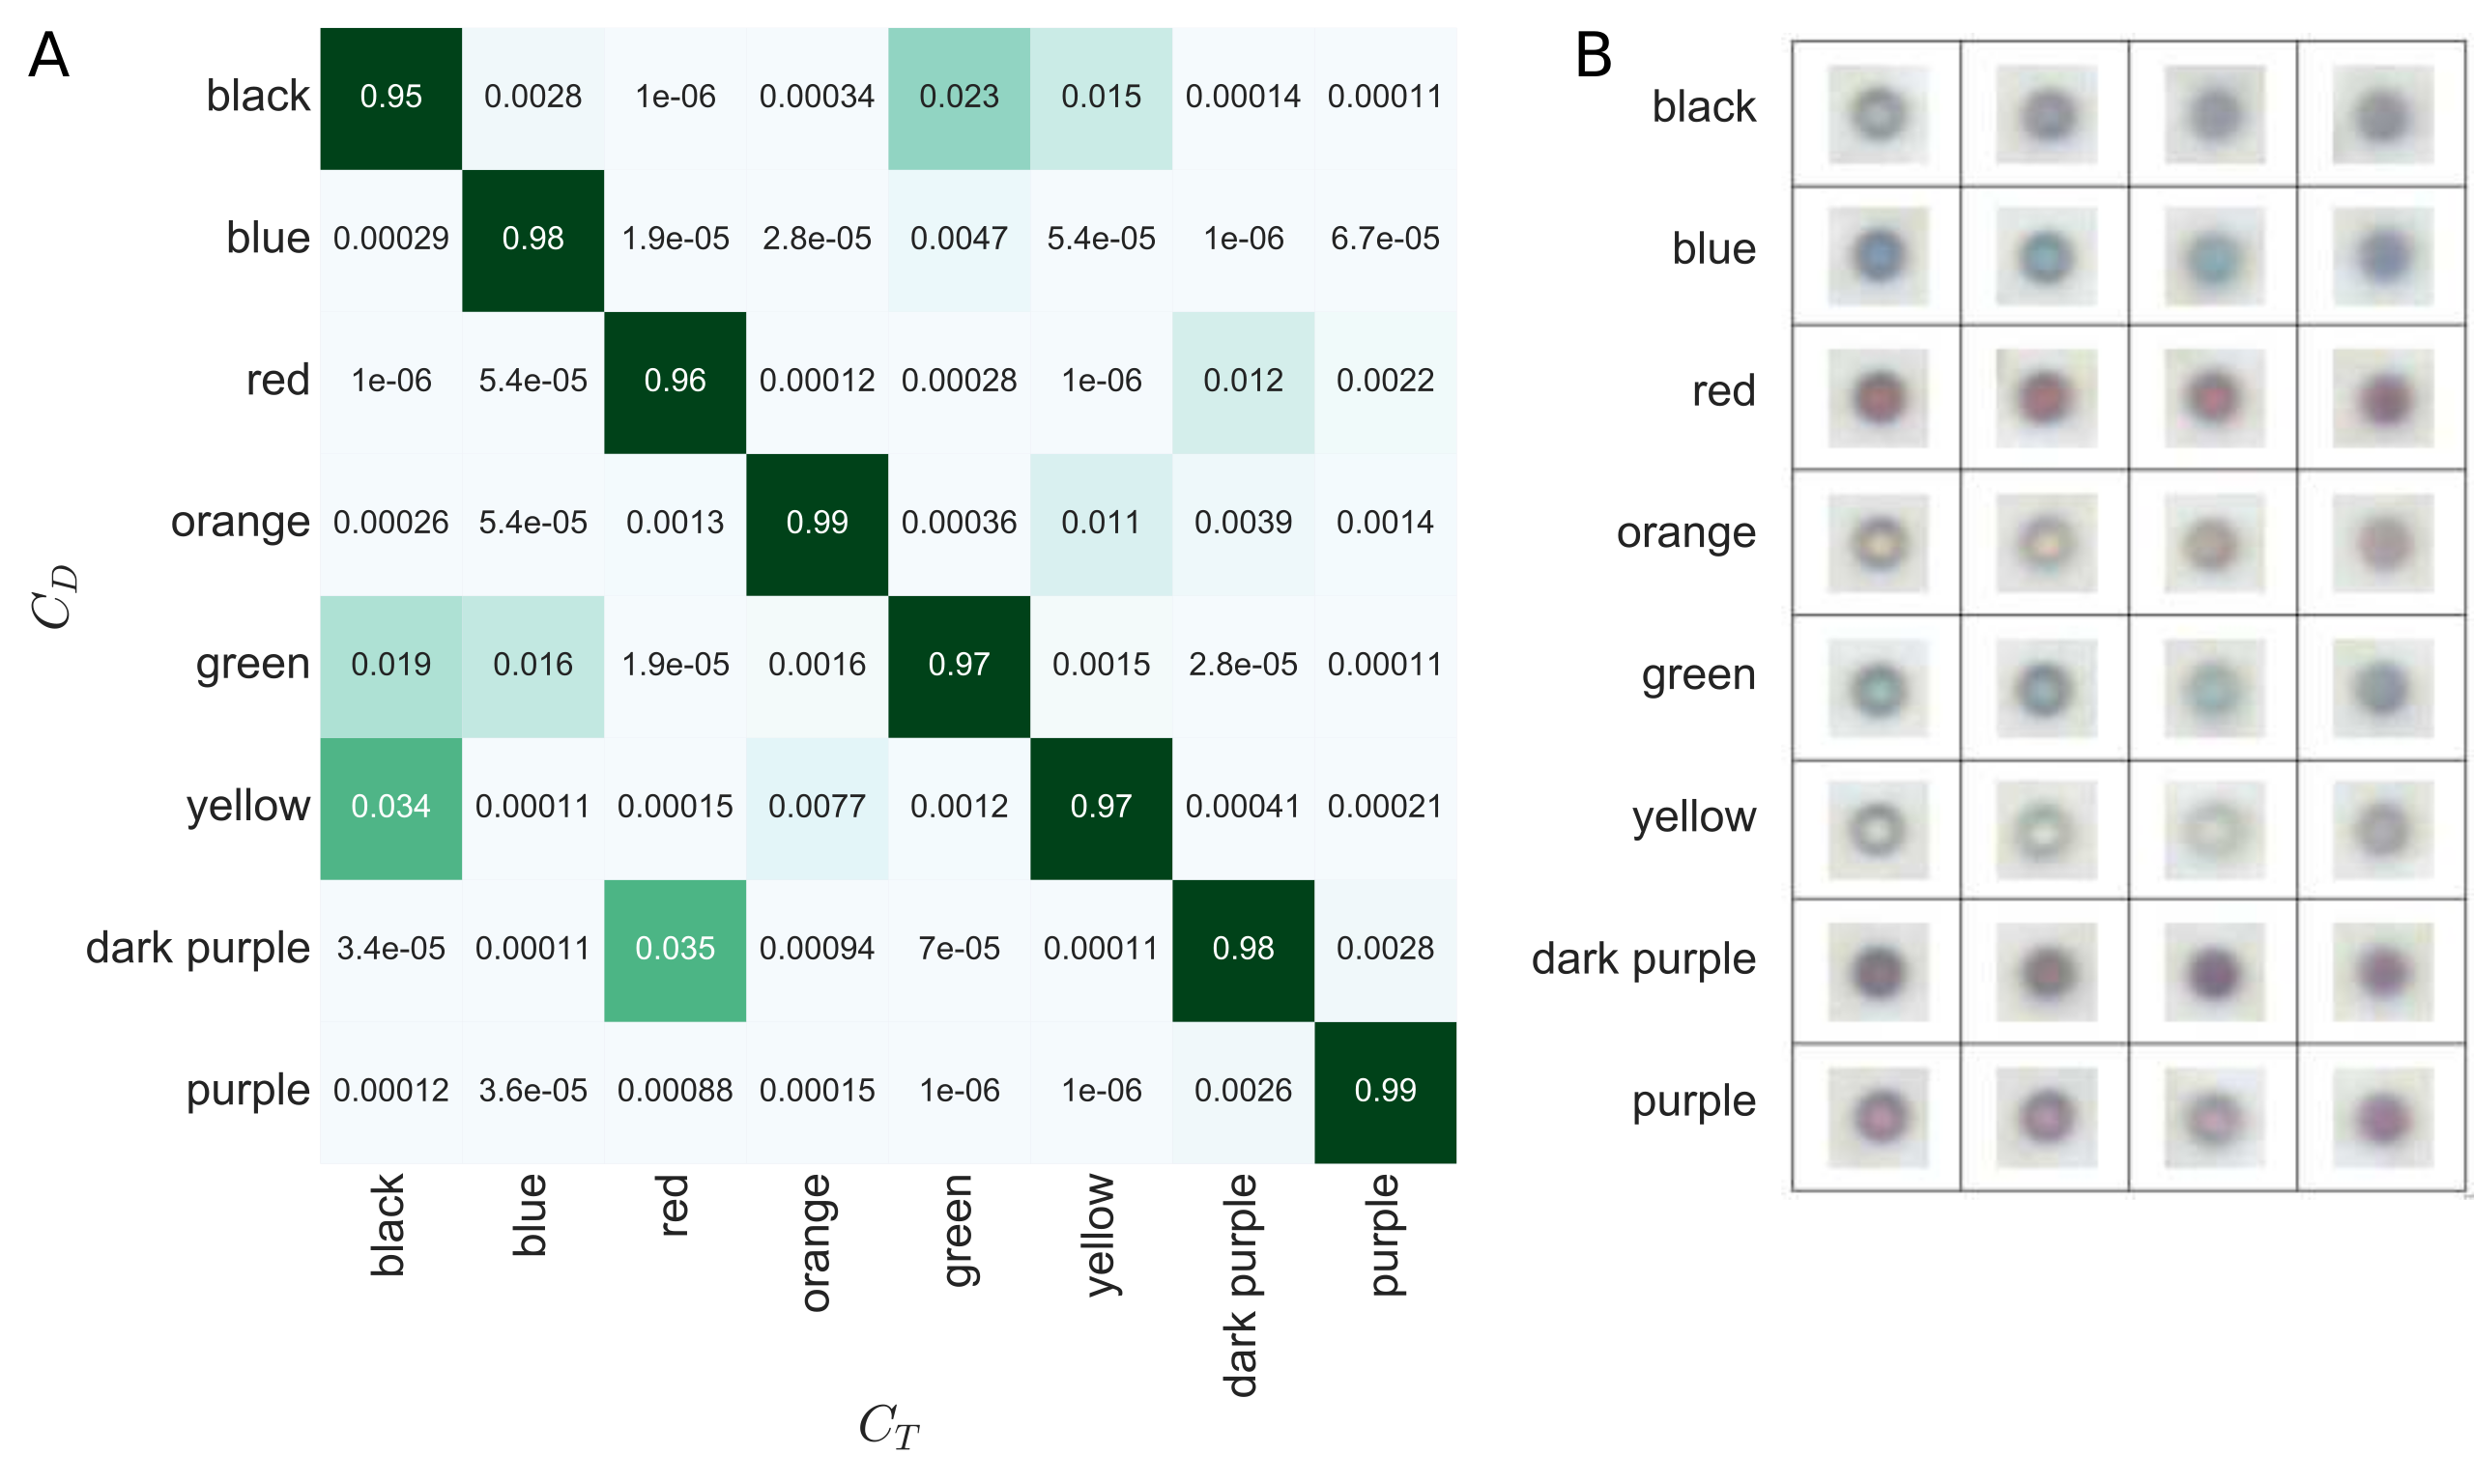
Performance of the Random Forest
The average accuracy of the Random Forest classifier is ~97% as can be concluded by this confusion matrix (A). Certain bead colors are much more likely to have a detected color, CD, that differs from their true color, CT. For example, black beads have a 3.5% chance of being detected as yellow. This information we take into account when correcting for possible misclassifications using Bayesian inference. The Bayesian decoding have a demonstrated accuracy of ~99.7% validated for 4259 droplets divided across 20 different experimental conditions.
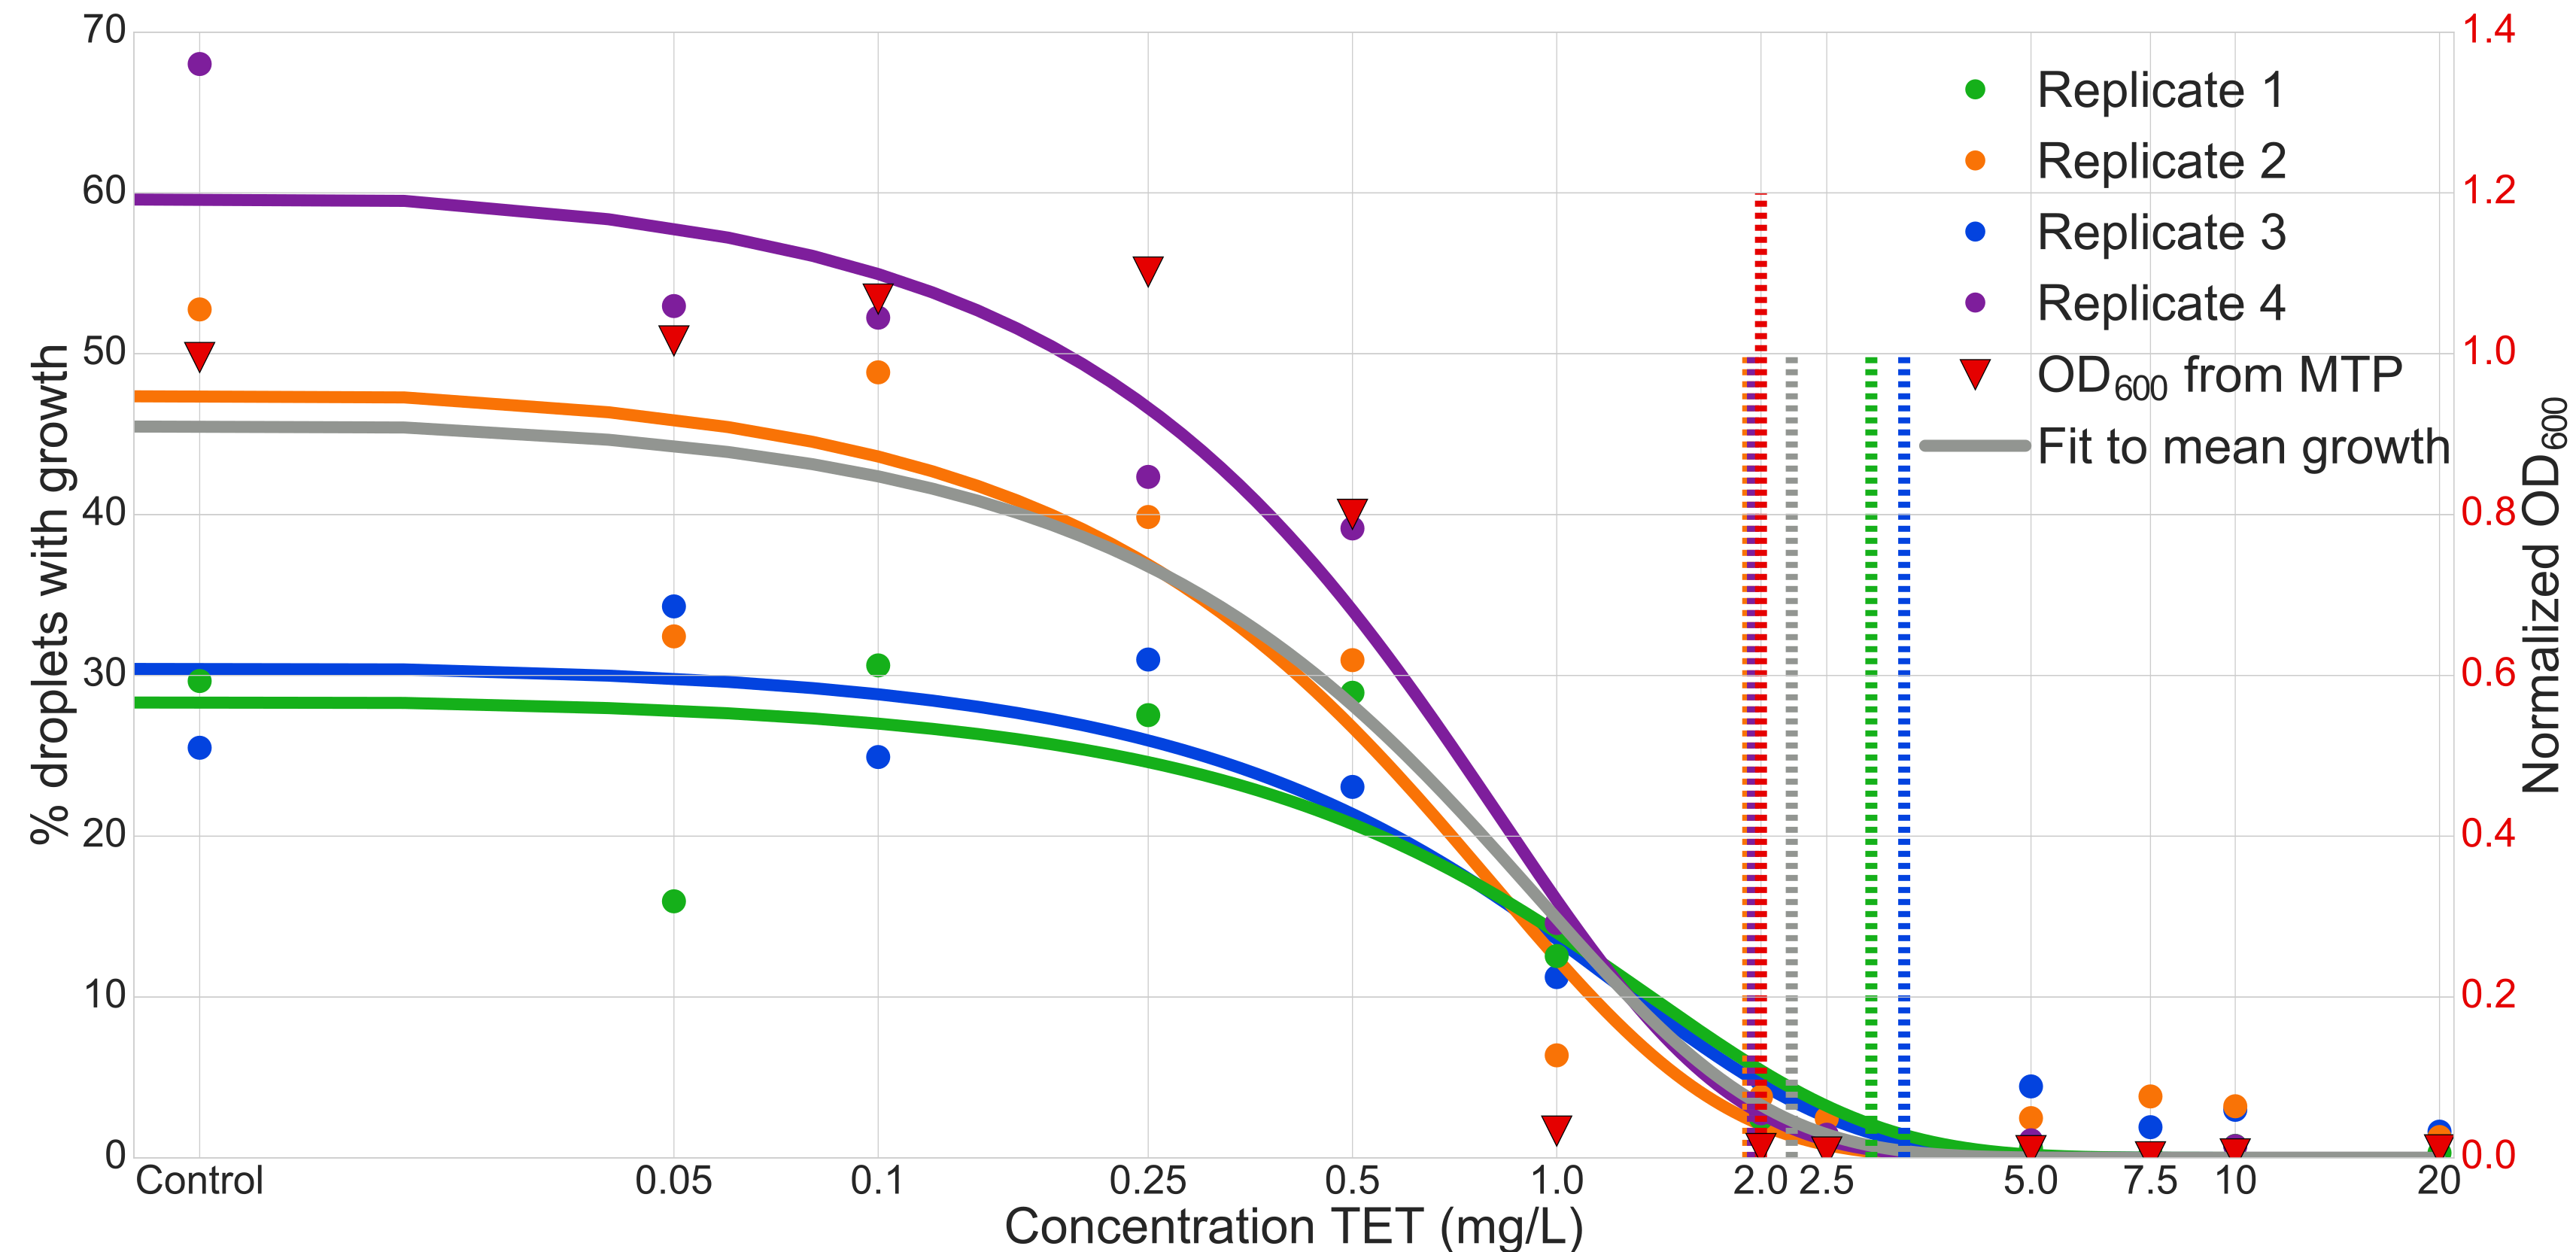
Minimum inhibitory concentration experiment
The coding/decoding strategy applied to the determination of the minimal inhibitory concentration (MIC) of the Tetracycline antibiotic (TET) against Escherichia coli strain ECJW922. For this experiment we used 12 different conditions in parallel. Results where confirmed by comparison to optical density (OD) experiments made in microtiter plates (MTP).
We have developed code that helps researchers segment droplet in general and this can be downloaded from our GitHub-page: