In this study we aimed to develop sensitive methods to quantify early pathological changes of the bones in a preclinical model of rheumatoid arthritis. Such methods are key to diagnose the disease in an early stage as well as to monitor treatment efficacy. We provide two measures that can be calculated from in vivo micro-CT images in an automated fashion: (i) the cortical thickness gradient and (ii) bone surface roughness.
Experimental Collaborators
- Department of Cell and Molecular Biology at the Leibniz-HKI in Jena, Germany
- Institute of Immunology at the University Hospital in Jena, Germany
- Institute for Molecular Cell Biology at the University Hospital in Jena, Germany
- Research Group of Regeneration in Hematopoiesis: Immunology of Aging at the Leibniz-FLI in Jena, Germany
Cortical Thickness Gradient (CTG)
The image stack is first binarized by texture-based segmentation in combination with k-means clustering into foreground (cortical bone) and background (soft tissue and background) pixels. The three middle metatarsal bones are then extracted by a semi-automated routine and orthogonalized based on their principal axes. For each metatarsal, the inner and outer cortical bone radius is extracted for different angles θ and at each position ξ of the orthogonalized image stack.
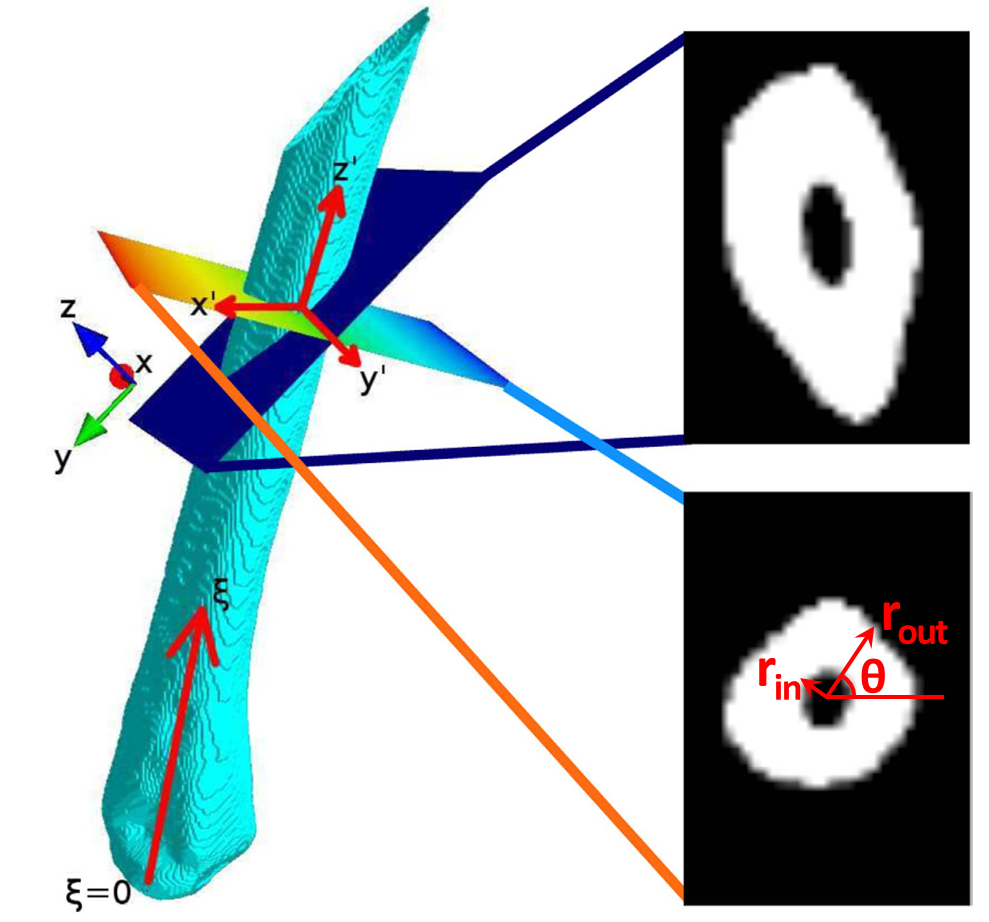
Orthogonalization of metatarsal bone
The principal axis of the bone is extracted and all images of the image stack are transformed so that they are perpendicular to the new main axis $z’$
The cortical thickness Ψ(ξ,θ) is calculated as the difference of rout(ξ,θ) and rin(ξ,θ) and averaged over all θ to obtain a one-dimensional signal. The CTG is then the slope of a linear function fitted to the profile of Ψ(ξ) (solid lines in image below).
The CTG is clearly lower before arthritis induction compared to day 35 of arthritis progression, where there is a substantial loss of cortical bone near the metatarsophalangeal joint.
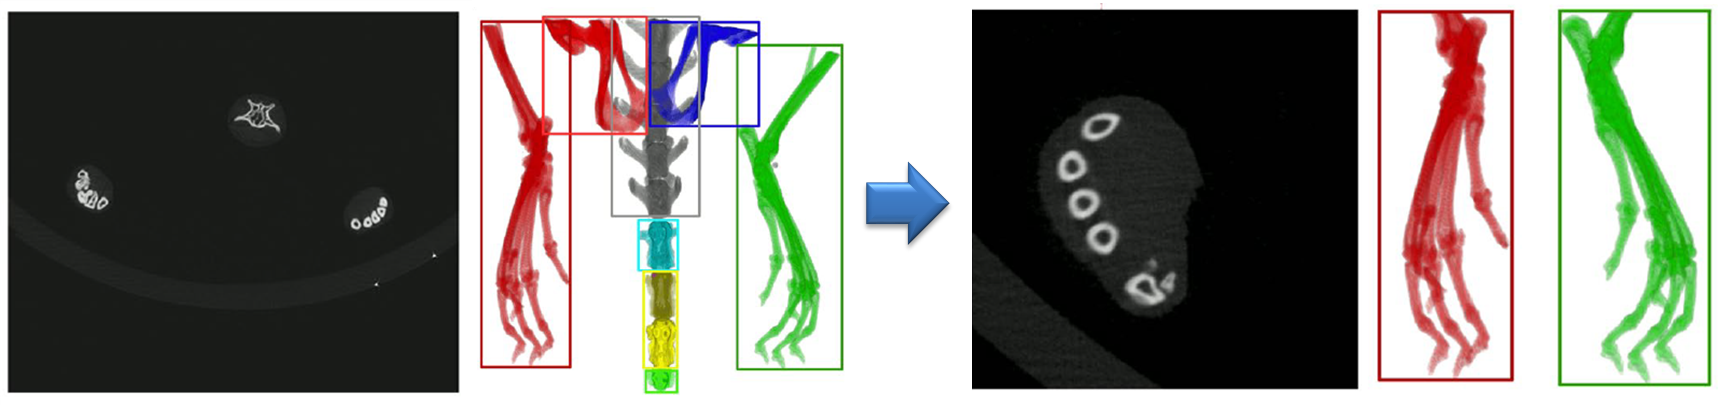
Automated extraction of volumes of interest from CT image stacks
The hind paws are extracted automatically from the CT image stacks based on thresholding and removal of small connected components and structures that are not located in the image regions where the paws are expected.
Three-dimensional surface meshes are constructed for both hind paws with the marching cubes algorithm and the roughness is calculated for the cortical bone surface based on the angles between normal vectors of the individual triangles of the surface meshes. The scale on which roughness is measured is controlled by the roughness radius r. In addition, the roughness can be calculated for the inner and outer cortical bone surface separately to gain a more comprehensive understanding of the spatial dynamics of arthritis progression. Besides the quantitative evaluation of alterations of the bone surface, visualization of local roughness allows to examine the exact sites of bone damage.
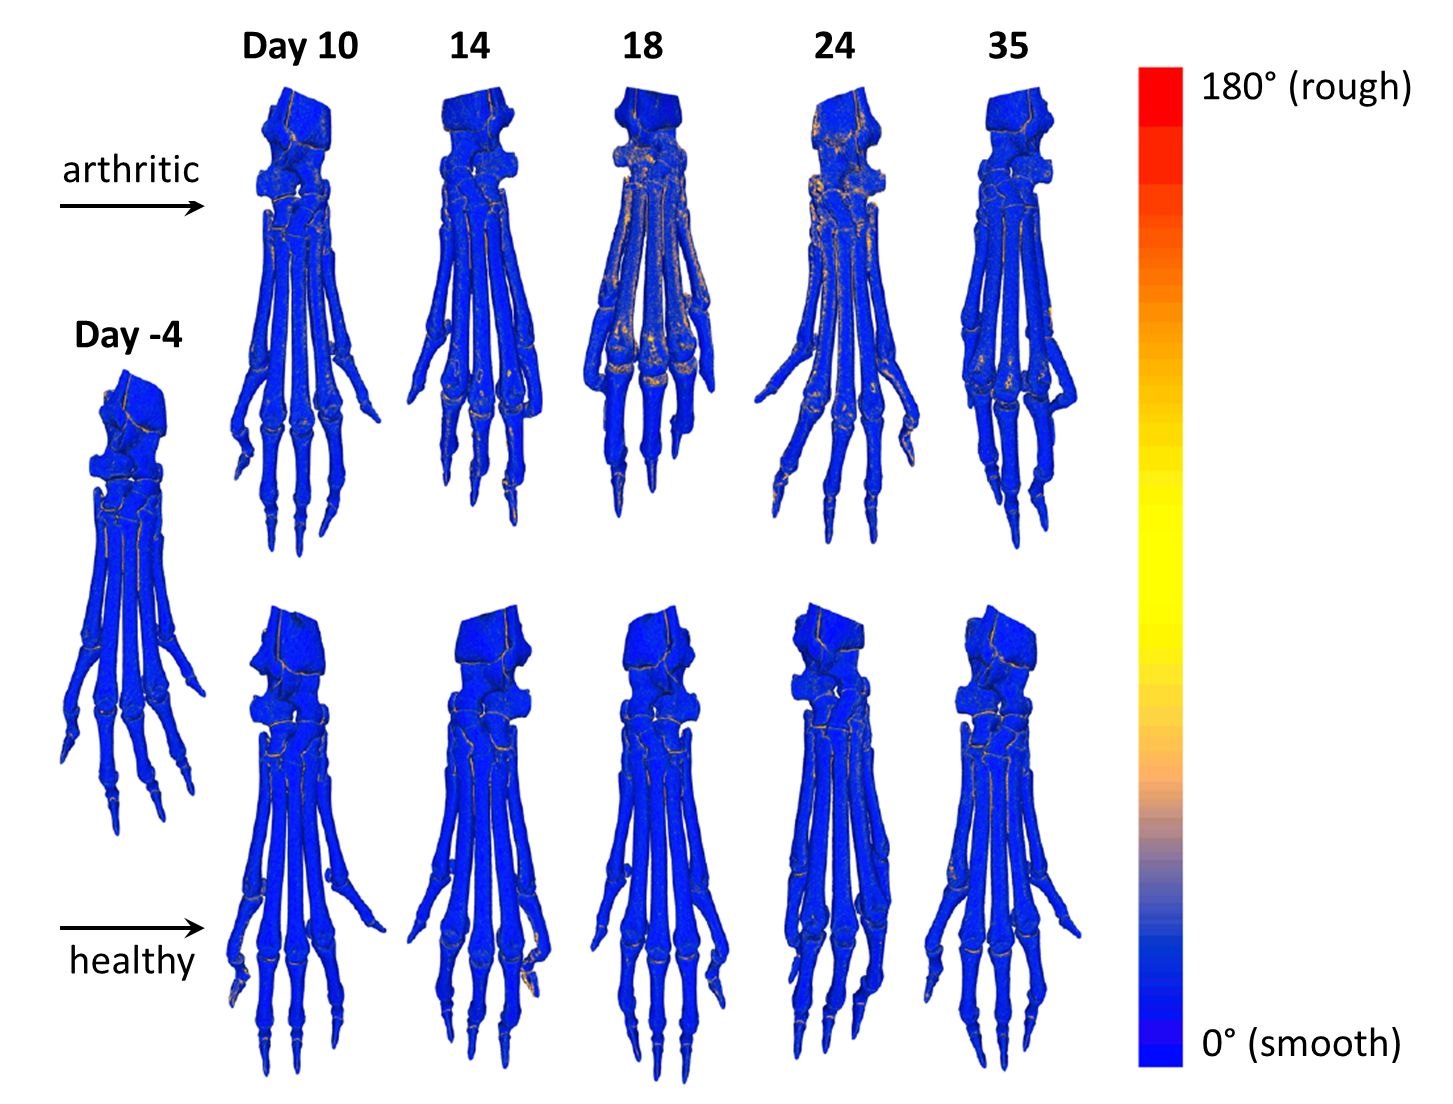
Visualization of bone surface roughness
The local roughness is color-coded by a gradient ranging from blue (smooth) to red (rough) color. While healthy animals show no signs of increased bone surface roughness at different time points of CT imaging, arthritic animals show erosion of the cortical surface especially at days 18 and 24 after induction of preclinical arthritis. At day 35, the bone surface roughness is declining, but the cortical surface shows small spots of bone damage close to the metatarsophalangeal joint.