
In this project we aimed to develop a toolkit for automated and objective analysis of multispectral optoacoustic tomography (MSOT) image data.
Experimental Collaborators
- Center for Sepsis Control and Care and Department of Anesthesiology and Intensive Care Medicine at the University Hospital in Jena, Germany
Current quantitative analysis methods of MSOT images are based on extracting signal intensities from confined regions of tissue. These methods demand expert knowledge of the sample anatomy, are time consuming, highly subjective and therefore prone to user bias. Our MSOT cluster analysis toolkit Mcat was designed to overcome these by applying a clustering approach to extract regions of similar signal kinetics from the entire sample. Instead of outlining a specific region of tissue, only a rough outline of the sample has to be provided, which is easy to perform even without expert knowledge of the sample anatomy. A comprehensive image preprocessing ensures that inter-scan intensity differences and motion artifacts of in vivo imaging are eliminated. Alongside the information about pharmacokinetics, it also provides insight into the biodistribution of the investigated biomarker.

Scheme of MSOT image analysis
After MSOT image acquisition, 4-dimensional image stacks are reconstructed and the sample is manually outlined. The image stacks are preprocessed and the main signal kinetics of the channel of interest are extracted by k-means clustering on the pixel level. The obtained pharmacokinetics are then used to quantitatively compare treatment groups and the spatial biodistribution of the utilized biomarker can be visualized.
Experimental Validation
We validated our analysis approach by quantifying liver function in a preclinical sepsis model based on the clinically approved biomarker indocyanine green (ICG). While the traditional approach of analyzing signal intensities from liver tissue wasn’t able to detect clear differences in ICG uptake between healthy and diseased animals, we observed substantial differences in ICG pharmacokinetics utilizing our newly developed method.
ImageJ plugin Mcat
To make our new approach easily available and applicable for other researchers, we implemented it in our MSOT cluster analysis toolkit Mcat, a Java-based plugin for ImageJ. It provides an easy-to-use graphical user interface (GUI) and allows the definition of multiple parameter sets that can be executed automatically to screen optimal parameter settings. The software contains components that organize input data and parameters. Its two main components are termed project, which contains all parameters and settings, and run, which is generated from a project and contains all necessary functions to perform the analysis with the desired parameter settings. The data processing steps are organized in a directed acyclic graph (DAG) where the nodes are the processing steps and edges represent dependencies between these steps.
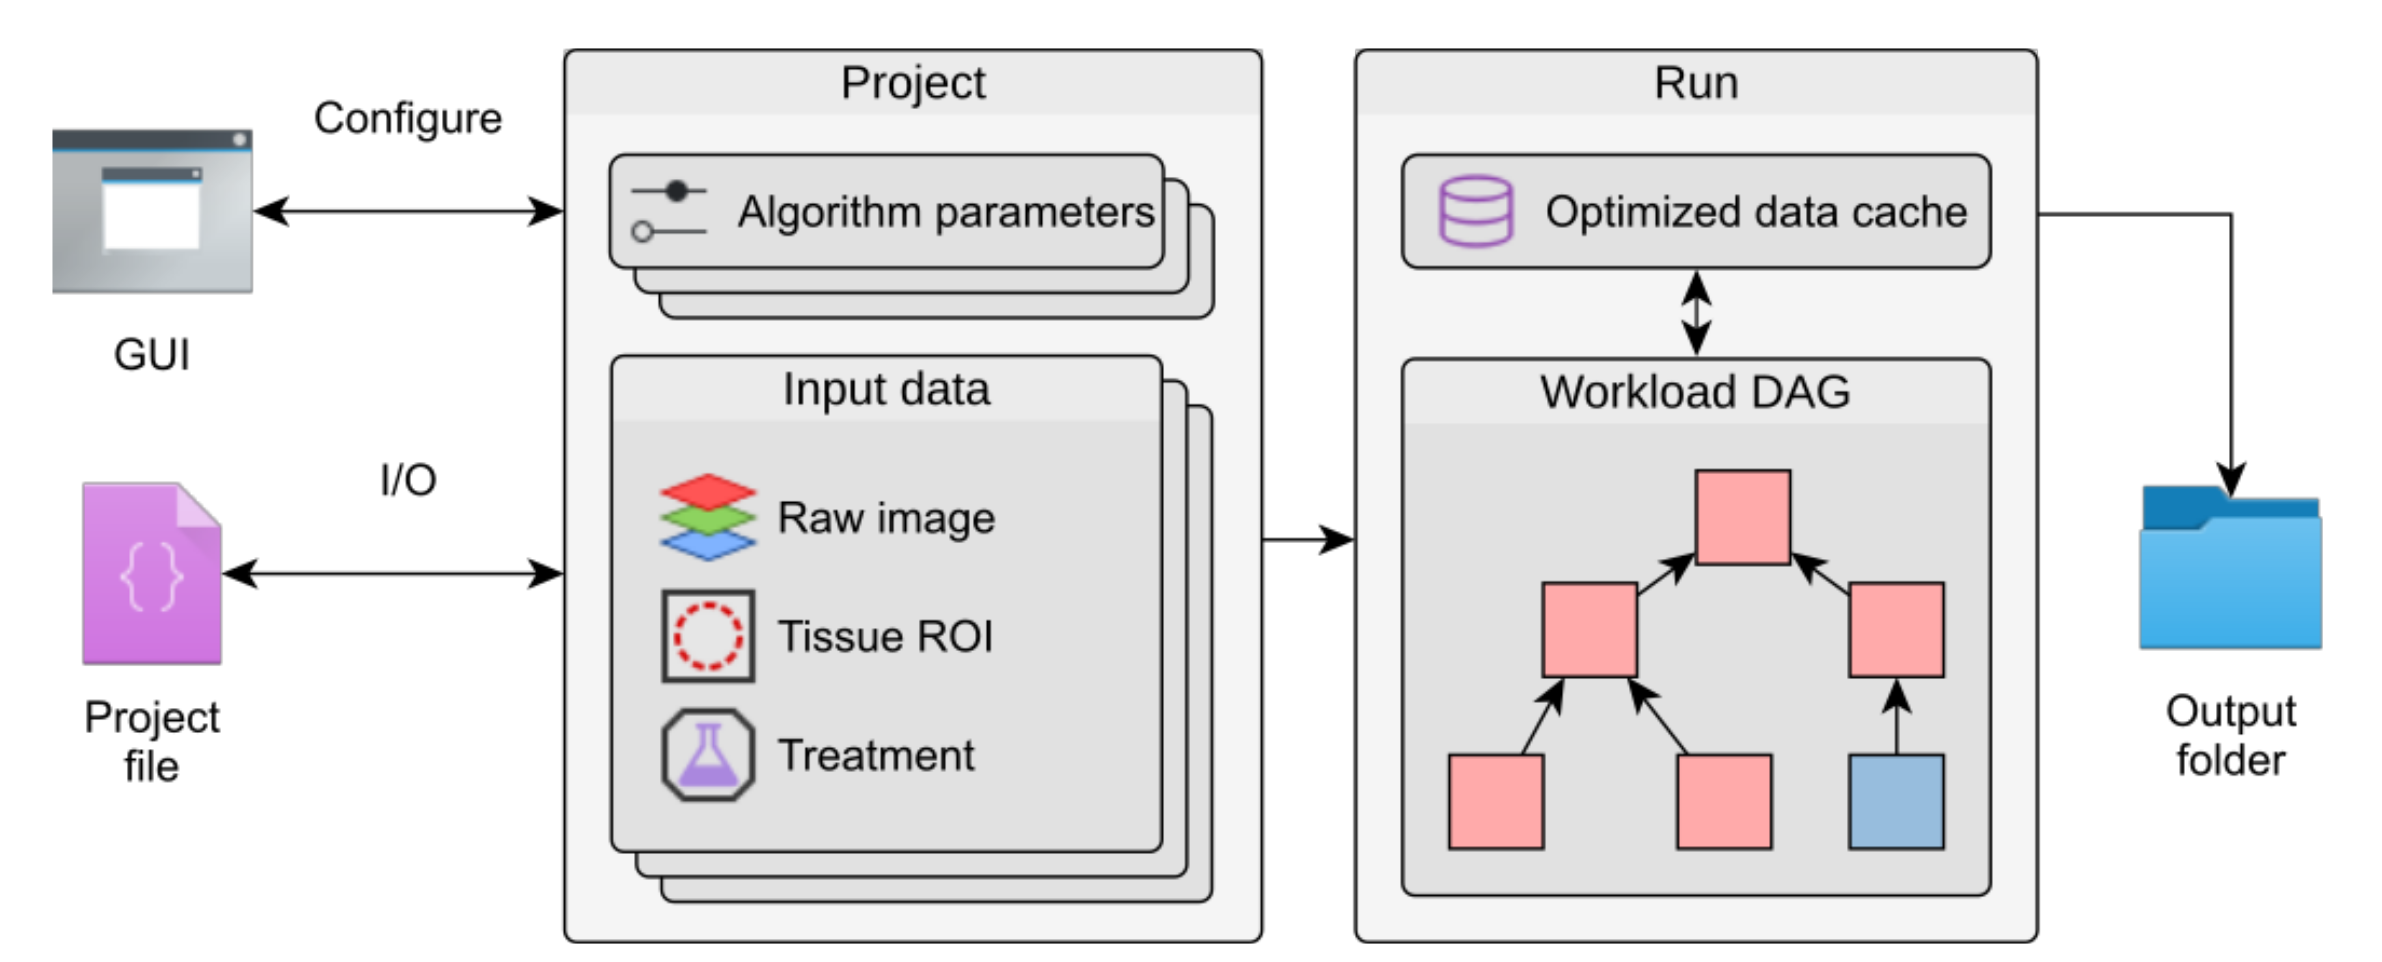
Internal structure of Mcat
Mcat organizes data in projects that store parameter sets and group image data and regions of interest (ROIs). Parameters can be configured in a graphical user interface (GUI). A directed, acyclic graph (DAG) models the dependencies between individual algorithms and, in conjunction with an optimized data cache, prevents duplication of workloads when running multiple parameter sets at once. The results are written to an output folder together with a project file that stores metadata of the run.
Publications
-
Press et al. (2021) Targeted delivery of a phosphoinositide 3-kinase γ
γ inhibitor to restore organ function in sepsis through dye-functionalized lipid nanocarriers. EMBO Molecular Medicine - Hoffmann, Gerst et al. (2022) Spatial quantification of clinical biomarker pharmacokinetics through deep learning-based segmentation and signal-oriented analysis of MSOT data. Photoacoustics